Measuring Training ROI: 4 Metrics That Actually Matter to the CFO
· 6 min read · OneRange Team
Completion rates won't grow your L&D budget. Learn the four training ROI metrics CFOs actually fund — skill uplift, time to competency, gap closure, and mobility.
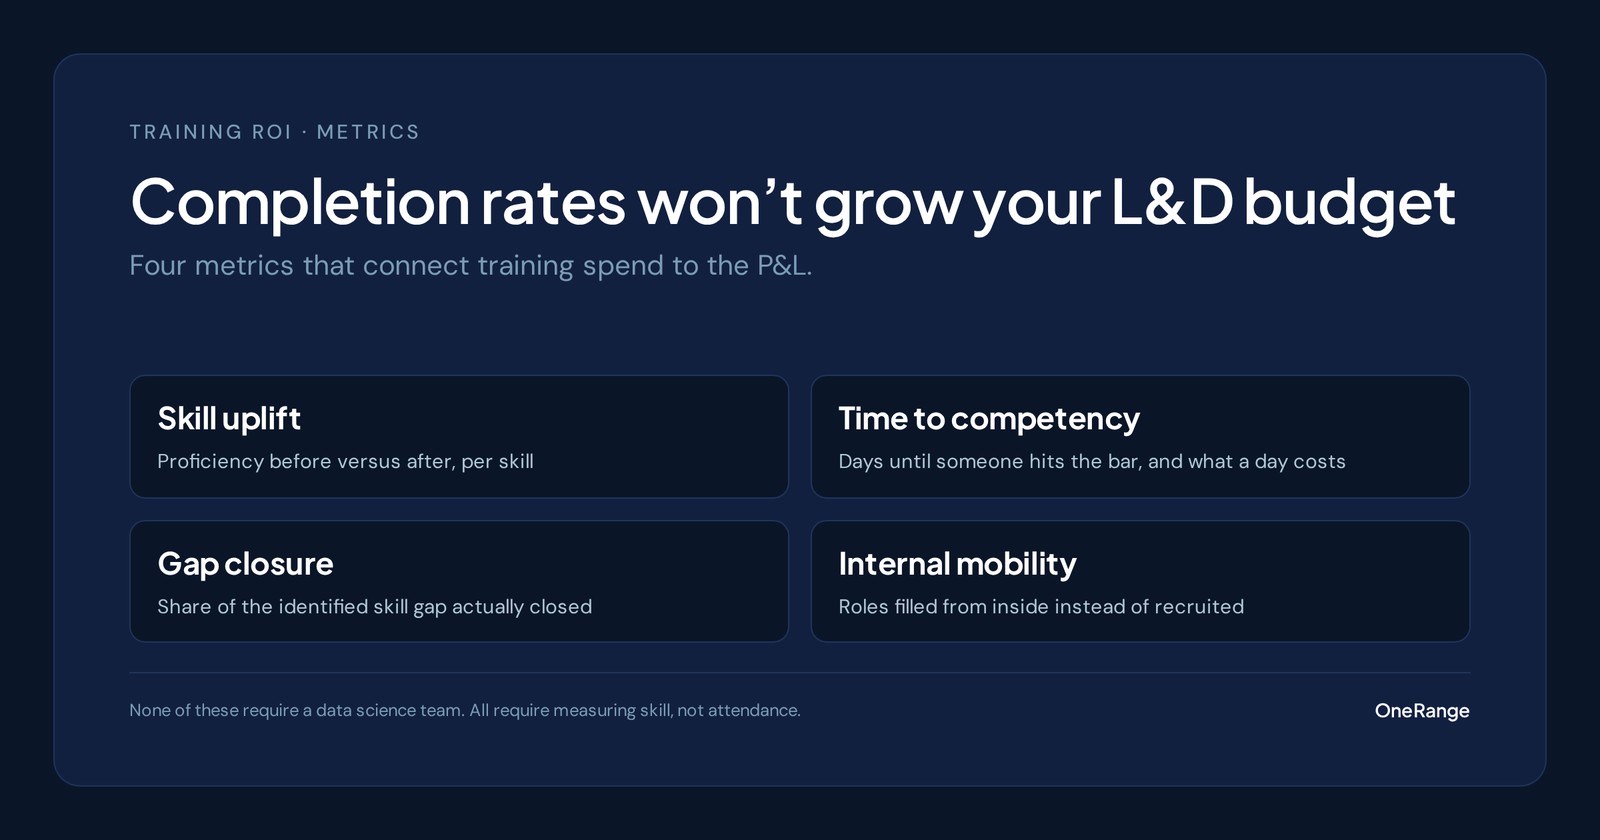
Completion rates won't get you a bigger L&D budget. Here are the four workforce metrics that connect training spend to revenue, retention, and operational efficiency.
If your L&D dashboard leads with course completion percentages, your CFO has already stopped reading. Completion is an input metric — it tells you whether training happened, not whether it worked. And in a budget meeting, "97% of employees completed the course" answers a question nobody asked.
The question the CFO is actually asking is simpler: what did the business get for this money? The four metrics below answer it. None of them require a data science team. All of them require you to measure skill, not attendance.
What is training ROI, really?
Training ROI is the measurable business return — faster ramp times, closed skill gaps, internal promotions, retained revenue — produced per dollar of training spend. It is not satisfaction scores, completion rates, or hours logged. Those measure activity. ROI measures change: what someone can do after training that they couldn't do before, and what that ability is worth.
That definition matters because it changes what you instrument. If ROI is change, you need a before and an after for every metric you report.
1. Skill uplift
Measure proficiency before and after training using the same assessment rubric. A meaningful program moves a meaningful percentage of learners up at least one mastery level on the targeted skills.
The trap here is the assessment itself. If your "before" is a self-rating and your "after" is a multiple-choice quiz, you're comparing two different instruments and the delta means nothing. Use the same skill assessment on both ends — ideally one that measures applied ability rather than recall. (We've written about why AI-driven assessment beats the multiple-choice quiz — the short version is that recall and competence are different things, and only one of them shows up in job performance.)
Report skill uplift as a distribution, not an average: "41 of 60 sellers moved from Foundational to Proficient on discovery calls" is a sentence a CFO can act on. "Average score improved 12%" is not.
2. Time to competency
How many days does it take a new hire — or a recently promoted employee — to reach the proficiency bar for their role? Cutting this number by even 20% has a direct, modelable impact on revenue per employee.
This is the easiest of the four metrics to translate into dollars, because the model is arithmetic: an employee below the proficiency bar produces at a fraction of full output, so every week you remove from ramp time converts directly into productive weeks. If a new account executive ramps in nine weeks instead of twelve, you bought three weeks of quota-carrying capacity — multiplied across every hire this year.
To instrument it, you need two things most L&D teams don't have: a defined proficiency bar per role, and a way to check each person against it as they ramp. That's a skills taxonomy problem as much as a training problem — if your role definitions live in job descriptions rather than in a measurable skill profile, start there.
3. Gap closure rate
Track the percentage of identified skill gaps that are closed within the quarter they're identified. This is the metric that shows whether your L&D function is keeping up with the business.
Gap closure is the metric that changes L&D's posture from reactive to accountable. Most organizations can produce a skills-gap report; very few can tell you what happened to last quarter's gaps. When you report closure rate quarterly, three things follow. Training requests get prioritized against actual gaps rather than manager intuition. Stale gaps become visible — the one that's been open for three quarters is either mis-scoped or under-resourced, and either way it's now a conversation. And the L&D team gets something rare: a number that goes up because of their work.
A quarterly cadence matters more than the target number. A team closing 40% of gaps every quarter, visibly, will out-earn budget against a team that claims 80% once a year — because the CFO can watch the first number move.
4. Internal mobility tied to training
When an employee gets promoted or moves laterally, can you point to the specific training that prepared them? Linking training records to position history is how L&D stops being a cost center and starts being a talent pipeline.
Every internal fill has a market price: the recruiter fee, the ramp time, and the salary premium an external hire would have commanded. When someone moves up and you can show the training path that got them there, that delta is attributable — at least in part — to L&D. Over a year, the sum of those deltas is usually the largest single number on the training ROI ledger, and the ROI of internal mobility compounds: internal hires ramp faster and stay longer.
The instrumentation is a join, not a project: training completion records on one side, position history on the other. If both live in systems that share an employee ID, this is a report you can build this quarter.
How do you report training ROI to a CFO?
Pick two of the four metrics, instrument them properly, and report them every quarter on one page. Lead with the business number (weeks of ramp removed, gaps closed, internal fills), show the trend against last quarter, and keep completion rates in the appendix if you include them at all. Consistency beats comprehensiveness — a CFO funds numbers they've watched move twice.
Resist the urge to report all four at once. Two metrics with clean baselines and two quarters of trend will do more for your budget than four metrics with asterisks.
The bottom line
CFOs fund things they can model. Skill uplift, time to competency, gap closure rate, and training-linked mobility are all modelable — each one converts into dollars with arithmetic a finance team will accept. Pick two, instrument them properly, and report them every quarter. That's how training budgets grow.
If the blocker is measurement itself — no proficiency bars, no before-and-after assessment, no skill data beyond completions — that's the problem interactive AI training was built to solve: every session produces skill signal, so the ROI reporting builds itself as your people train.
FAQ
Frequently asked questions
What is a good ROI metric for corporate training?
The four that hold up in front of finance are skill uplift (proficiency movement on a consistent rubric), time to competency for new hires and role changers, quarterly gap closure rate, and internal mobility linked to training records. All four measure change, not activity.
Why don't completion rates demonstrate training ROI?
Completion measures whether training happened, not whether anything changed. An employee can complete a course without gaining measurable skill, and a CFO can't convert completions into dollars. Skill movement, ramp time, and internal fills all convert directly.
How often should L&D report training ROI?
Quarterly. It's frequent enough for finance to watch the trend and act on it, and long enough for skill movement and gap closure to actually register. Annual reporting hides both your wins and your problems.
Related
- The ROI of AI training — How to build a defensible business case for AI training spend.
- How to calculate AI training ROI — The formula, the inputs worth trusting, and the KPIs to report upward.
- AI training ROI calculator — Model the return on a training program with your own headcount and salary inputs.